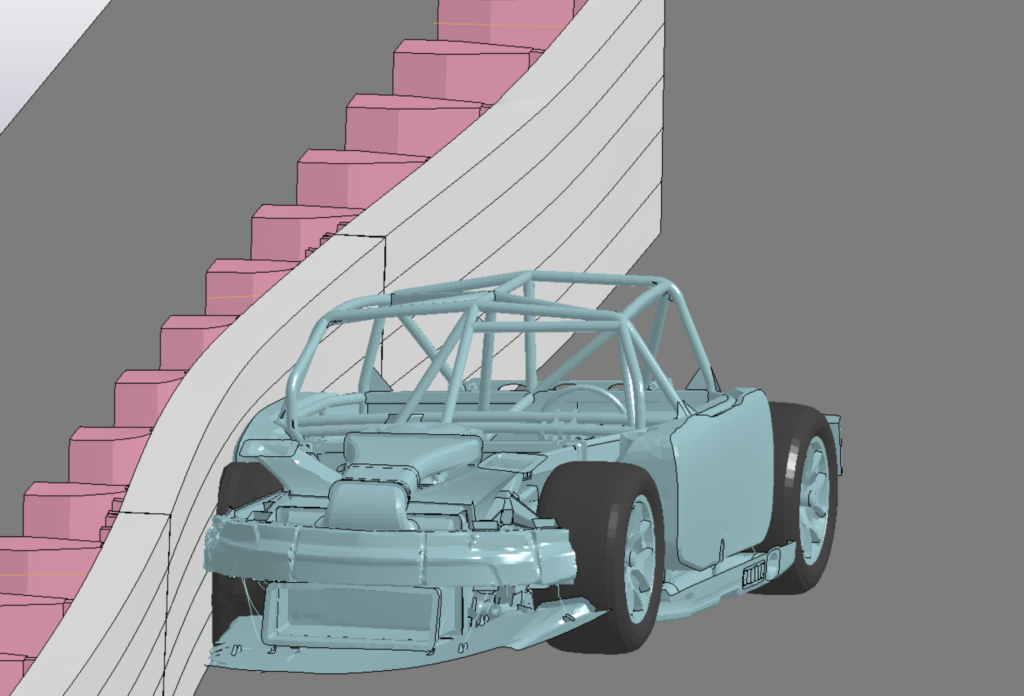
Crash safety improvement is an ongoing process for NASCAR, not necessarily tied to particular race cars or seasons. The sanctioning body has empowered its safety engineering team, based in Concord, North Carolina, and led by managing director John Patalak, to pursue improvements wherever it identifies a potential safety benefit. Nevertheless, an all-new race car design like 2022’s Next Gen machine for the Cup Series provides an opportunity to consolidate past learnings and introduce further design improvements.
Much of its initial safety development was completed remotely by Patalak’s team and chassis designer Dallara. Unlike the outgoing Gen-6 car, the clean-sheet Next Gen design deploys a single chassis for all brands, providing new opportunities for passive safety. “A single-supplier chassis is helpful because we’re not limited to the lowest level of fabrication or construction technology that a team may have,” Patalak explains. “An example of that is round-tube bending: we are no longer limited to a single-point bend. We have multiple bars in the chassis now that have continuous rolls in them. That enables us to make the car stronger without having to add weight.”
Digital design The safety design process began with NASCAR and Dallara working together on CAD-based FEA, iterating different geometries weekly or even daily to optimize deformation just beyond the elastic range. Once the version one prototype CAD chassis assembly was ready, the team commissioned Elemance, based an hour north of Concord and with whom NASCAR had previously worked on GHBMC human body modeling, to build out an Ansys LS-Dyna model from CAD data.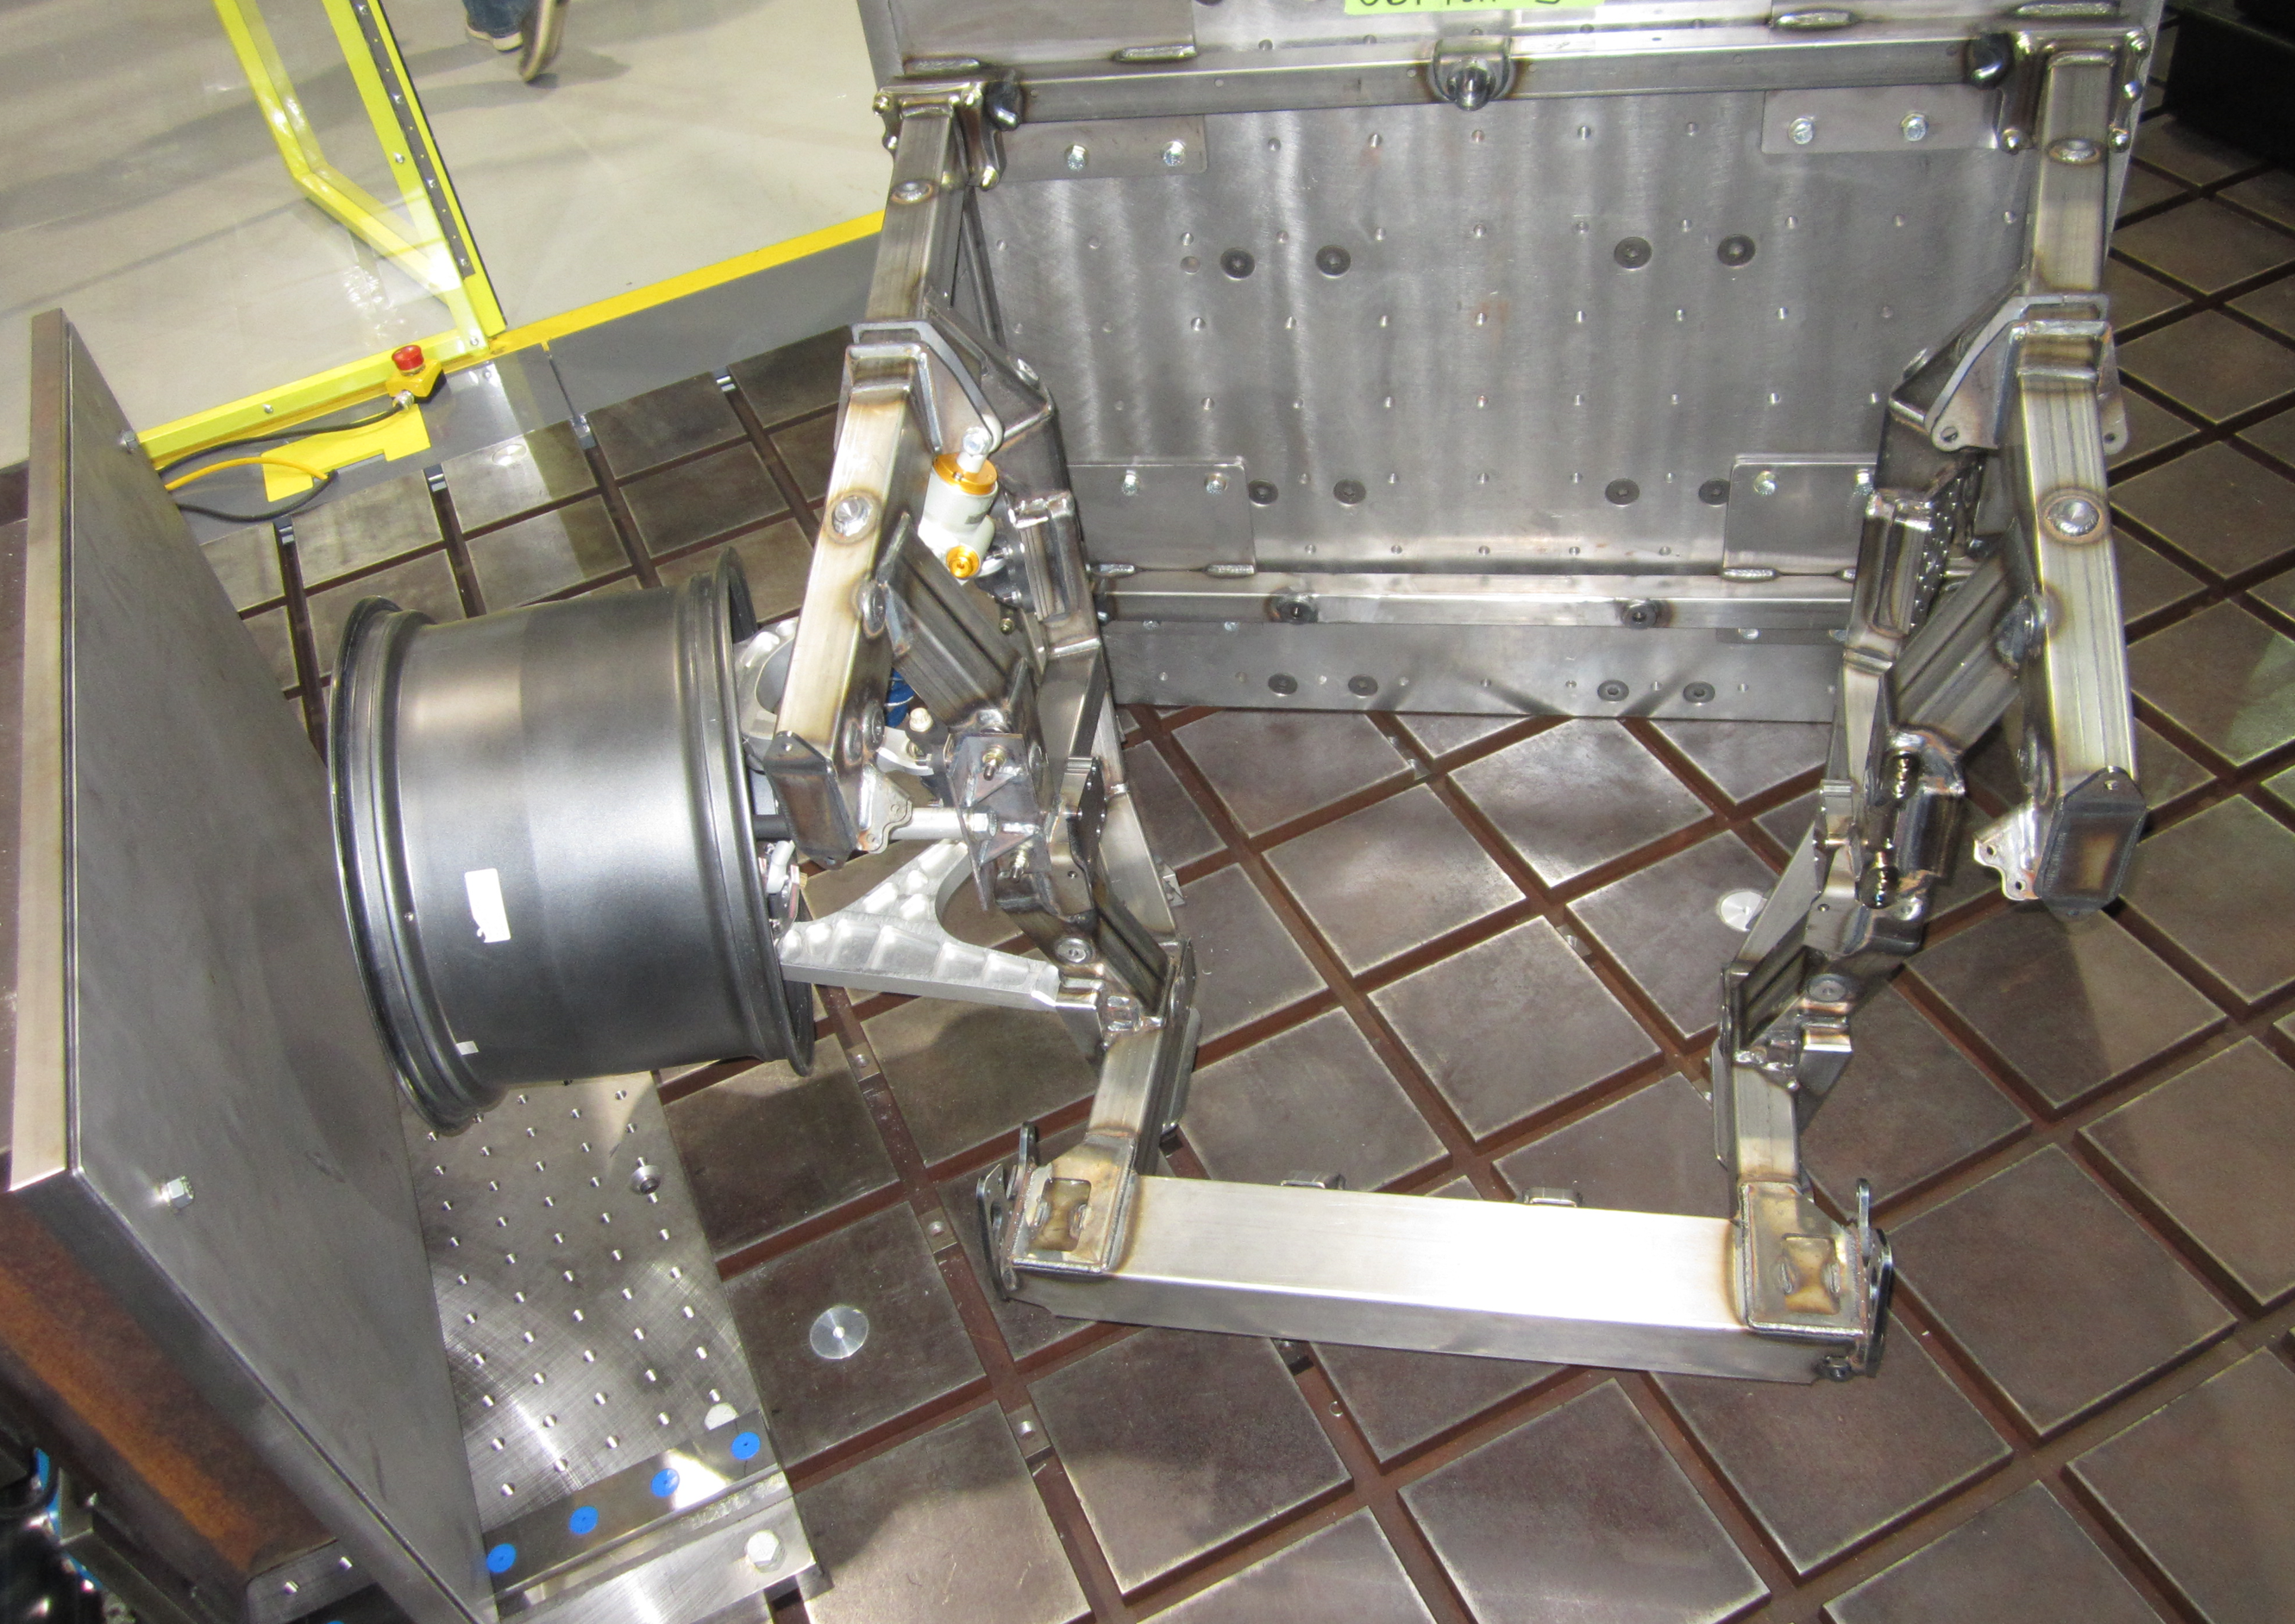 [pullquote]Above: The front clip was subjected to quasi-static load tests[/pullquote]
Once the model was prepared for simulations, NASCAR tapped into its historical crash database, examining real-world crash speeds, angles and trajectories to establish the boundary conditions for the right-frontal impacts, T-bones, rear impacts, roof crush cases and more, that would be used to assess and optimize the design. In all, more than 5,000 crash simulations were run.
Patalak notes that Elemance also completed some design of experiments work using LS-Opt, an optimization algorithm that alters material property, material thickness and geometry in an iterative fashion according to set goals. One example included optimizing the crash pulse for rear impacts while protecting the fuel cell integrity. Intermixed in multiple steps throughout the simulation process were crash tests of physical prototypes to validate the model. NASCAR took the rear half of a car to TRC in Ohio and ran rigid wall impacts. It also built up two Gen-6-based, Next Gen center section mules. These went to Ford in Dearborn, Michigan, for quasi-static roof crush testing to be conducted.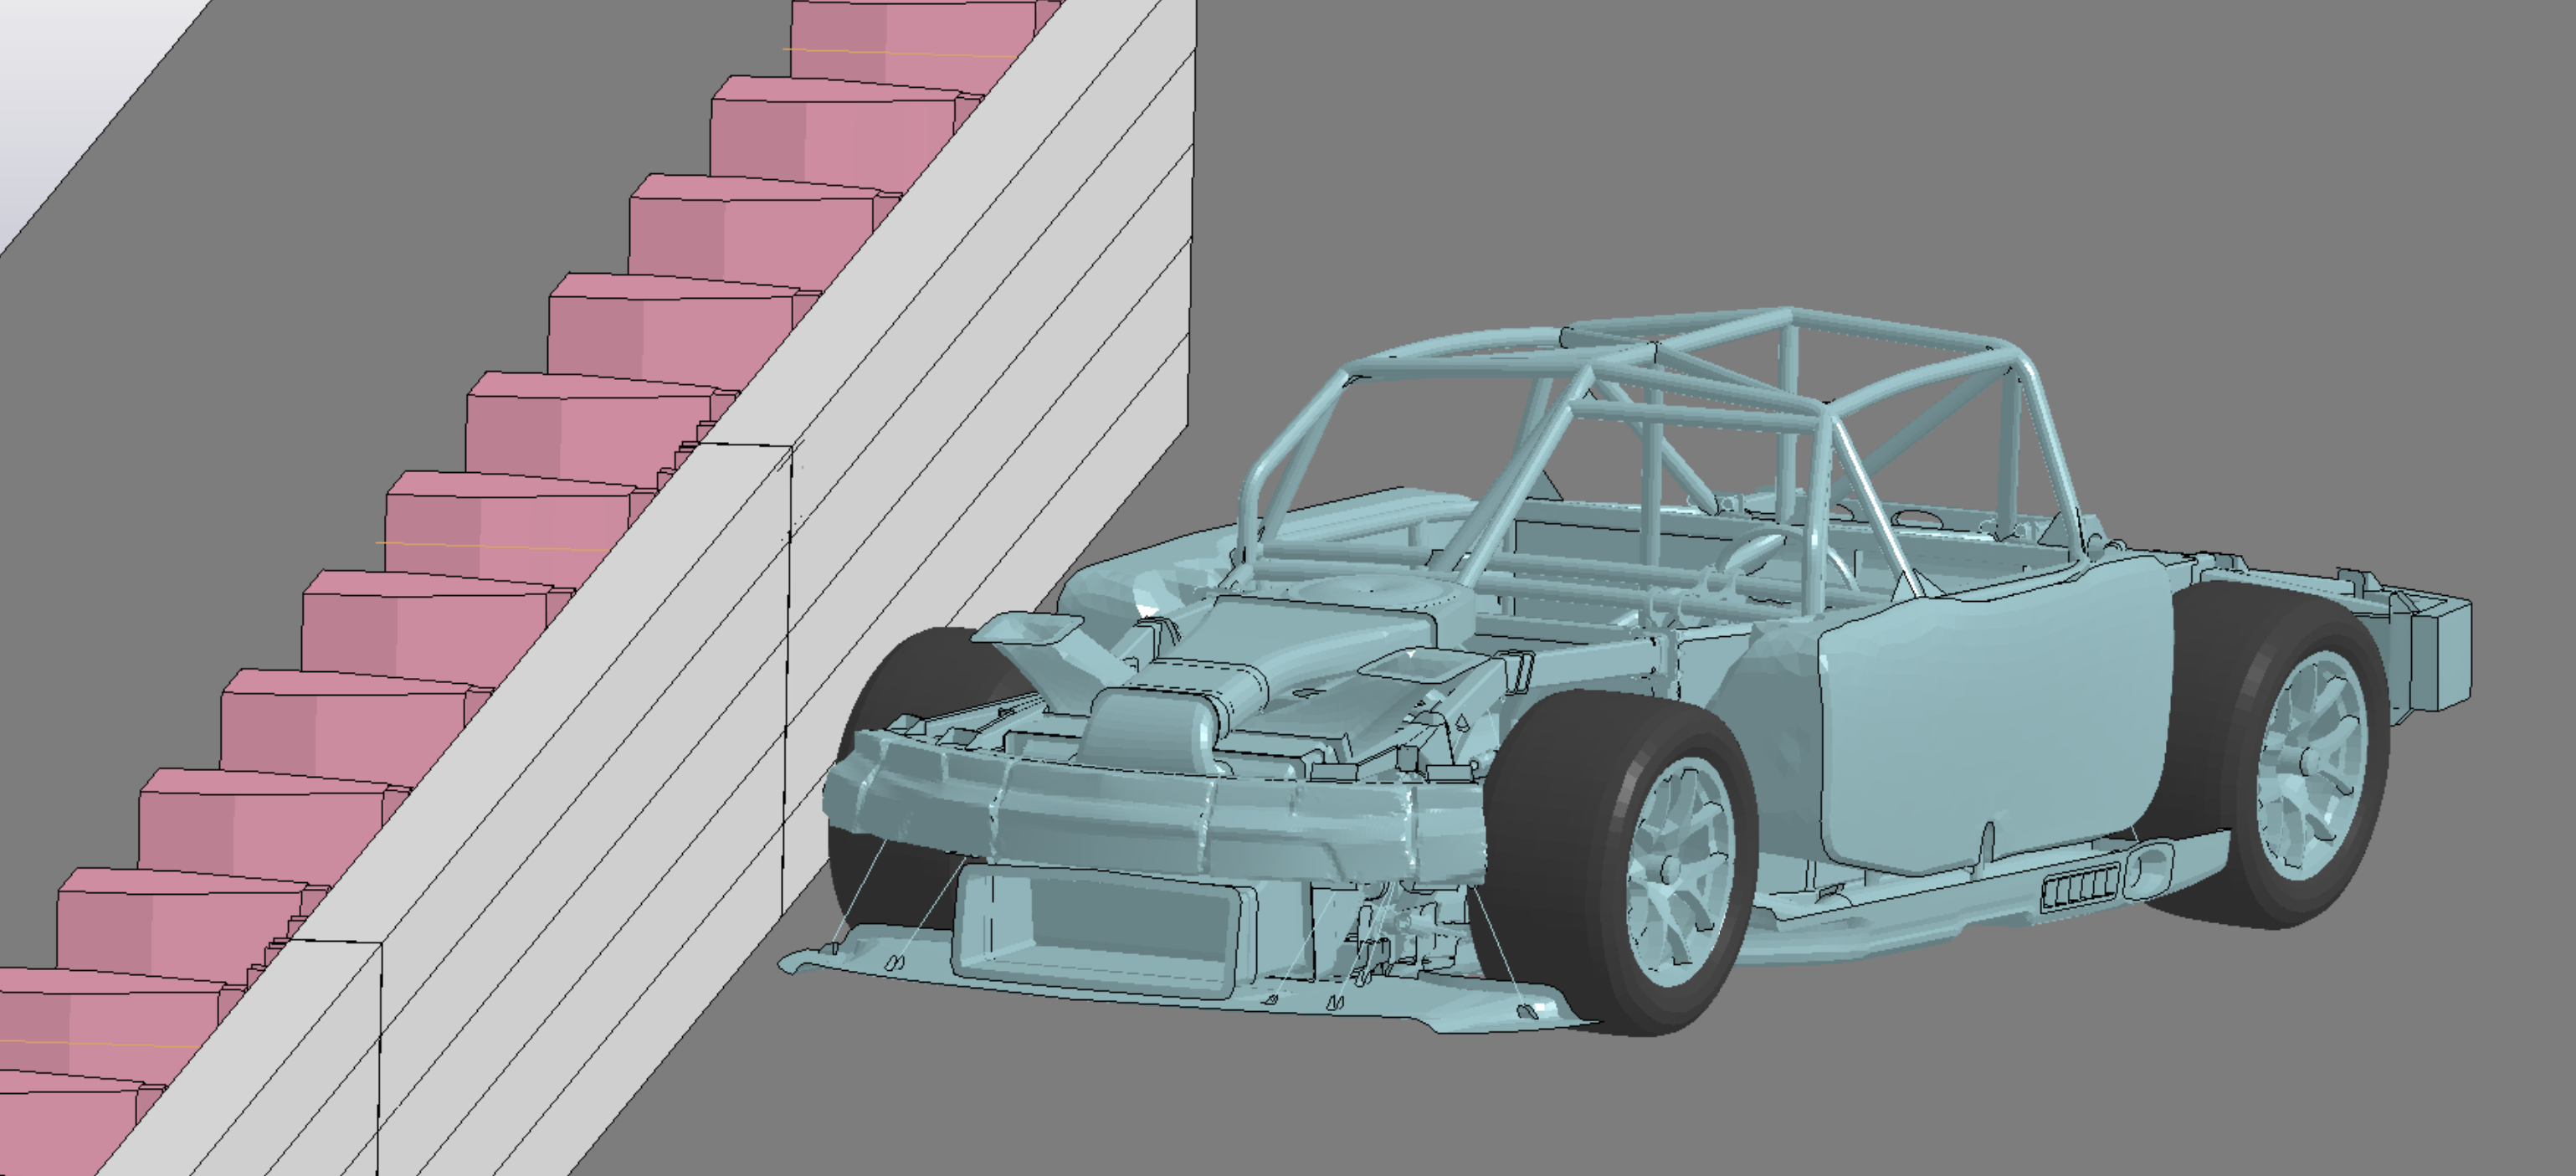 [pullquote]Above:LS DynaSim was used to model crash scenarios using historical data[/pullquote]
Talladega testing
By June 2021, the team had built confidence in the simulation results and it was time for a full-car, right-frontal crash test. As has been the case historically, the performance of the area forward of the firewall when subjected to the right-frontal principal direction of force (PDOF) became the focus for the full-car test. NASCAR’s usual lab at the University of Nebraska-Lincoln was unavailable and an alternative venue could not be found in North America because of the demanding 209km/h impact speed and lengthy test setup time. 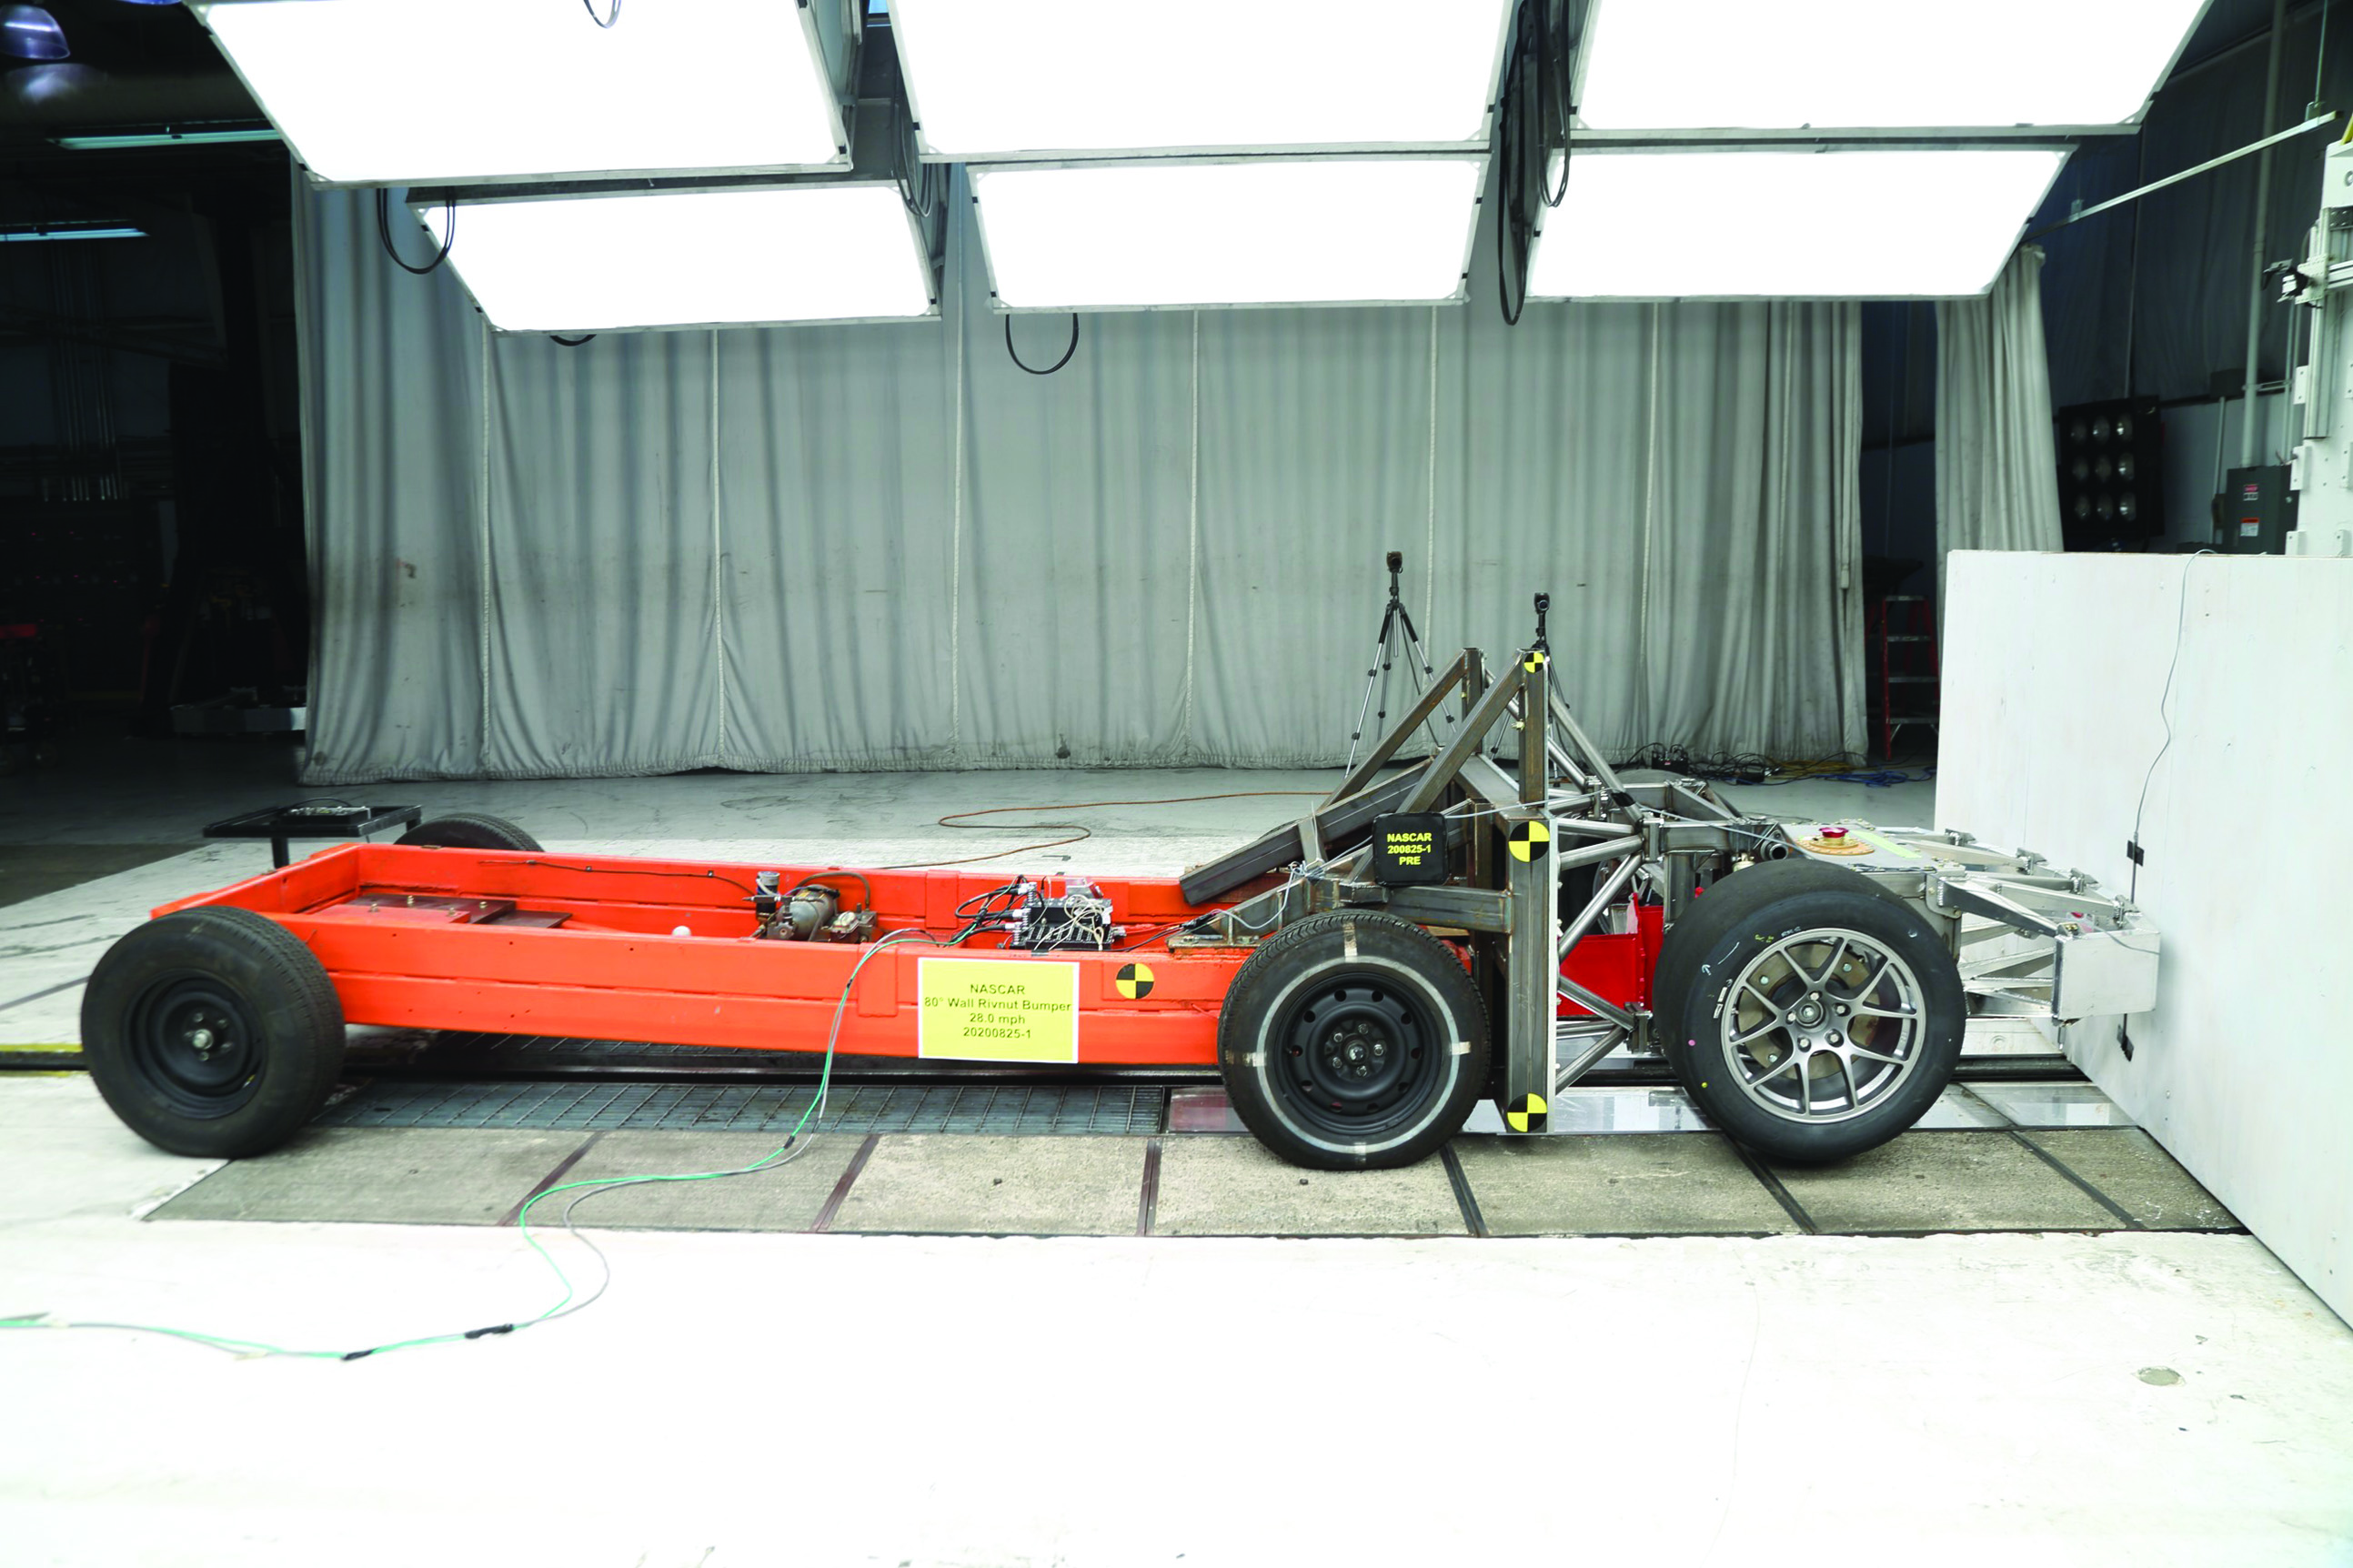 [pullquote]Above: NASCAR took the rear half of a car to TRC in Ohio and ran rigid wall impacts[/pullquote]
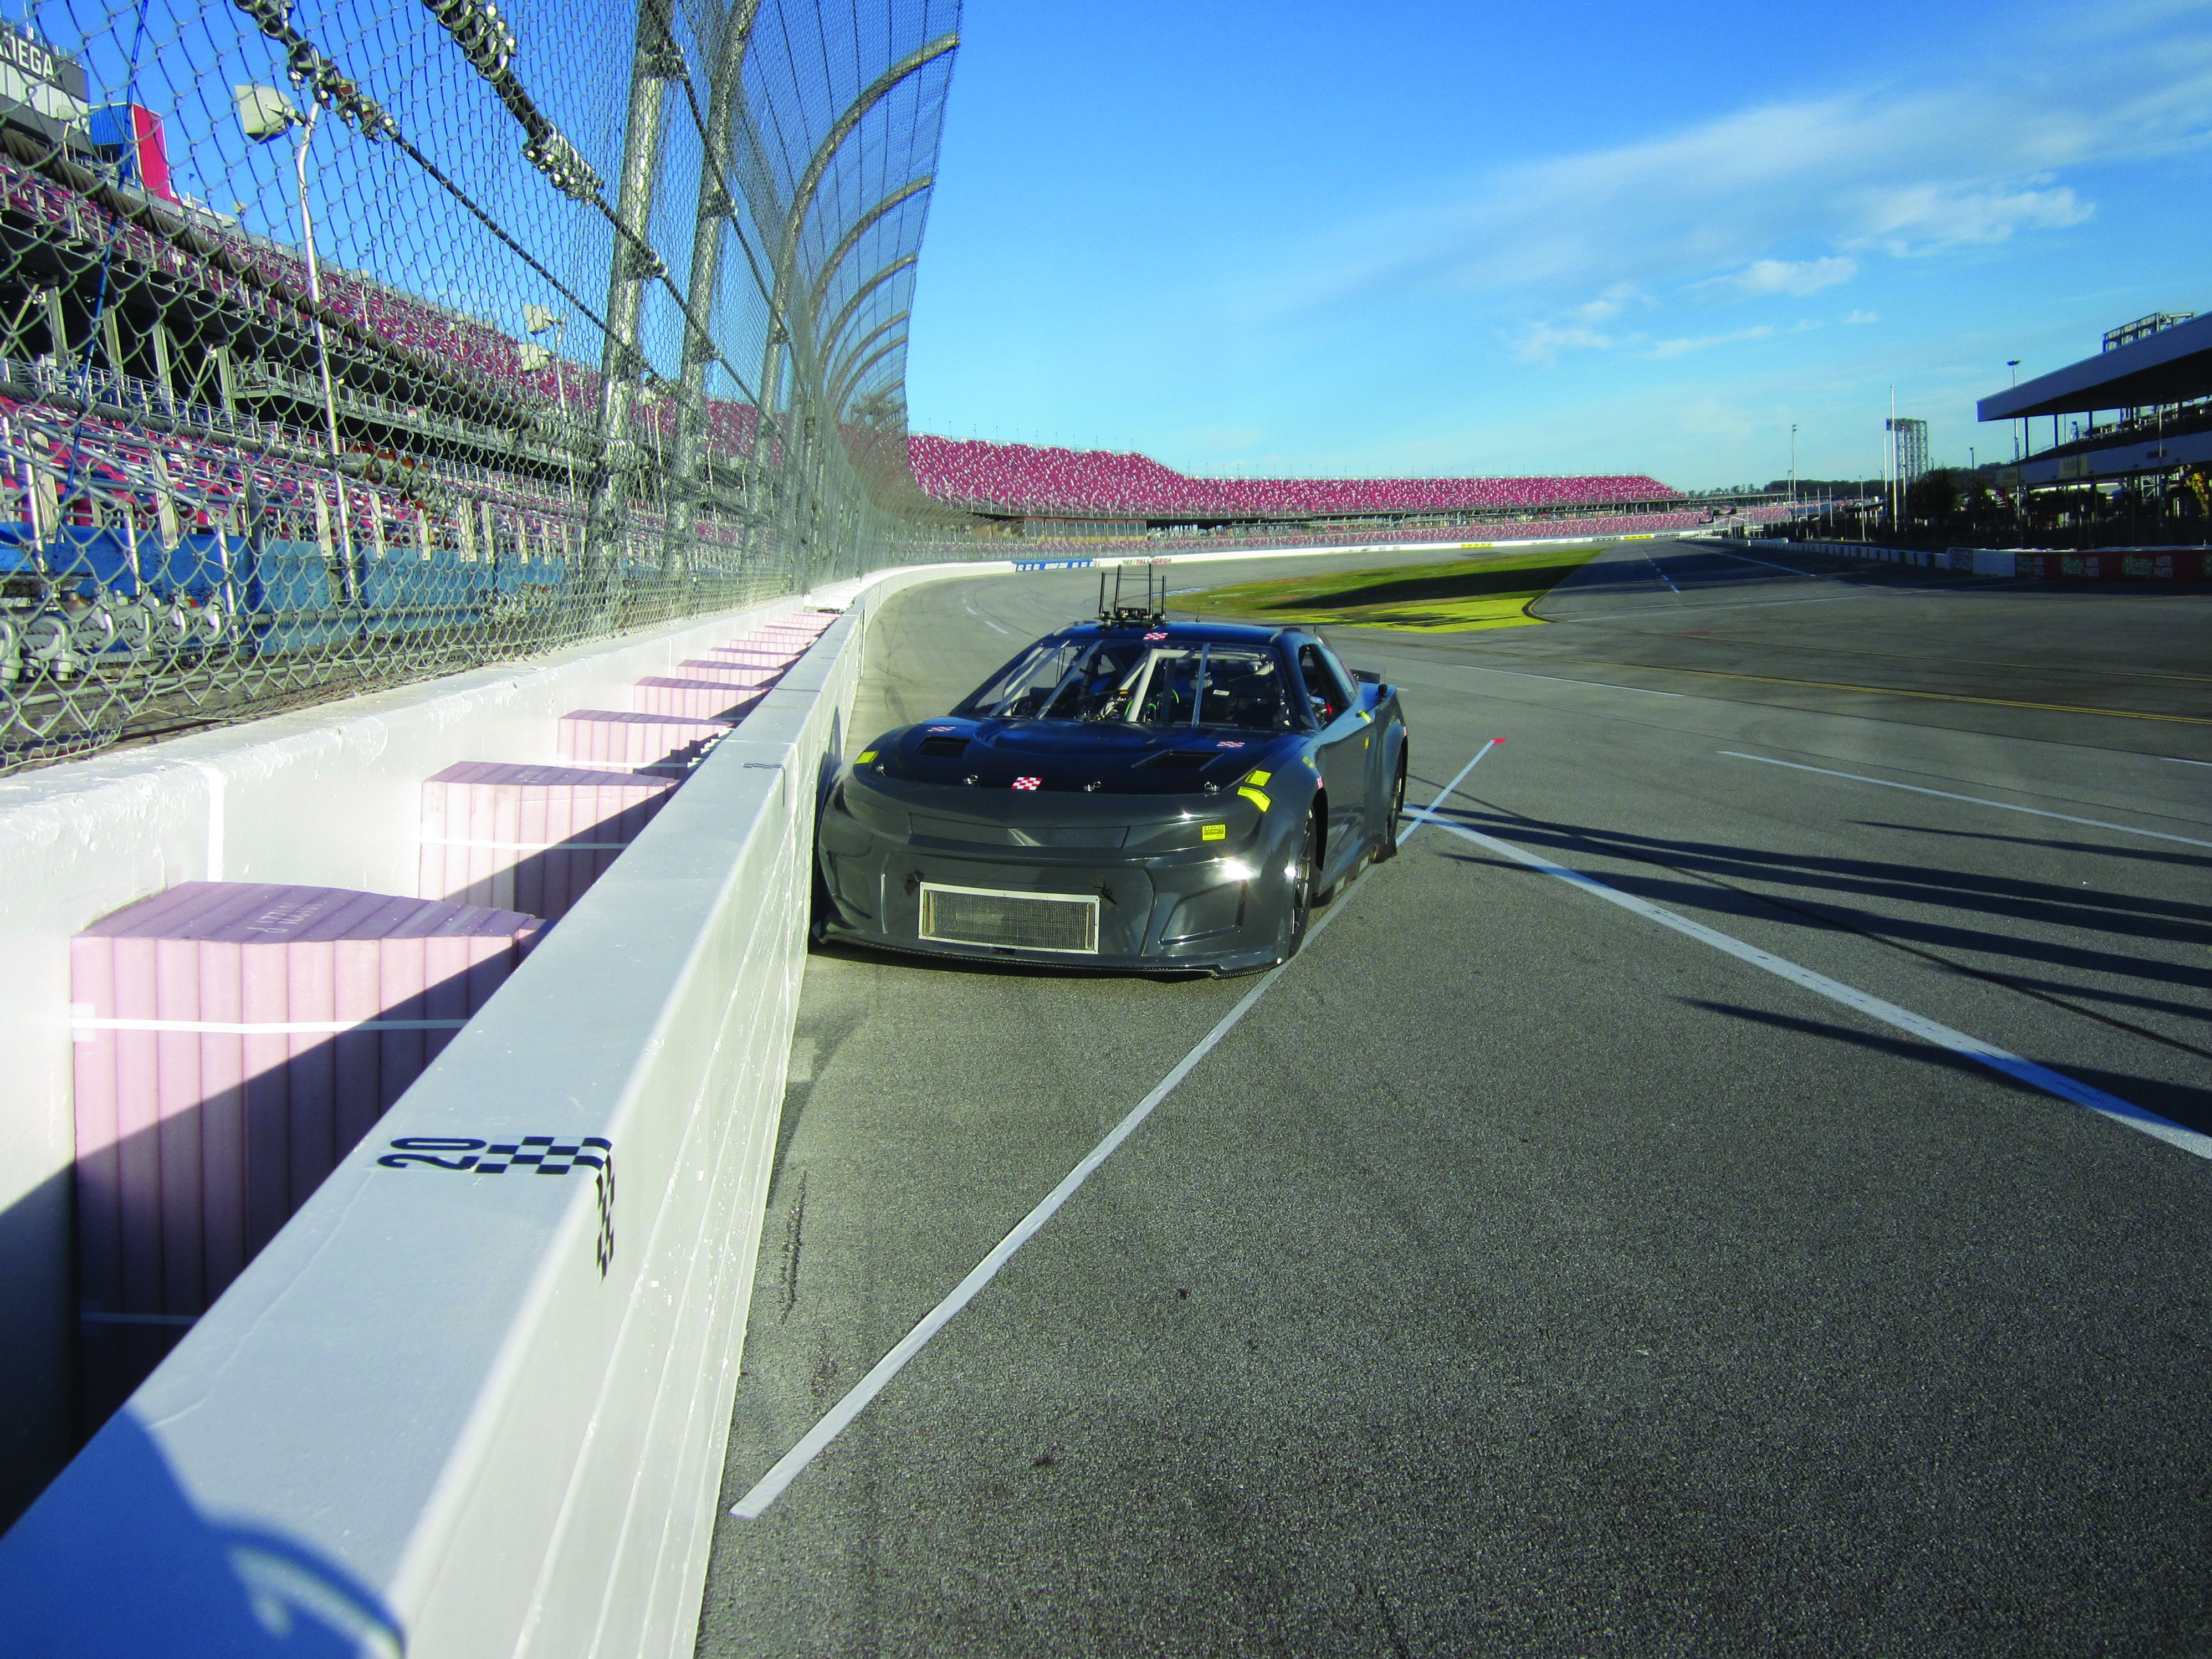
The innovative solution was instead to autonomously crash a running race car at Talladega Superspeedway in Alabama. “It was the most realistic solution and the simplest one from a planning standpoint, but certainly not from an execution standpoint,” admits Patalak, whose team worked with AB Dynamics on the tests.
“We started out locally at the zMAX Dragway in Concord: a very safe, controlled environment between walls. Once we could get the robots to do a smooth take-off, shift and stop, we went over to Charlotte Motor Speedway where we had more space to get through the gears. All of that built confidence before Talladega.” 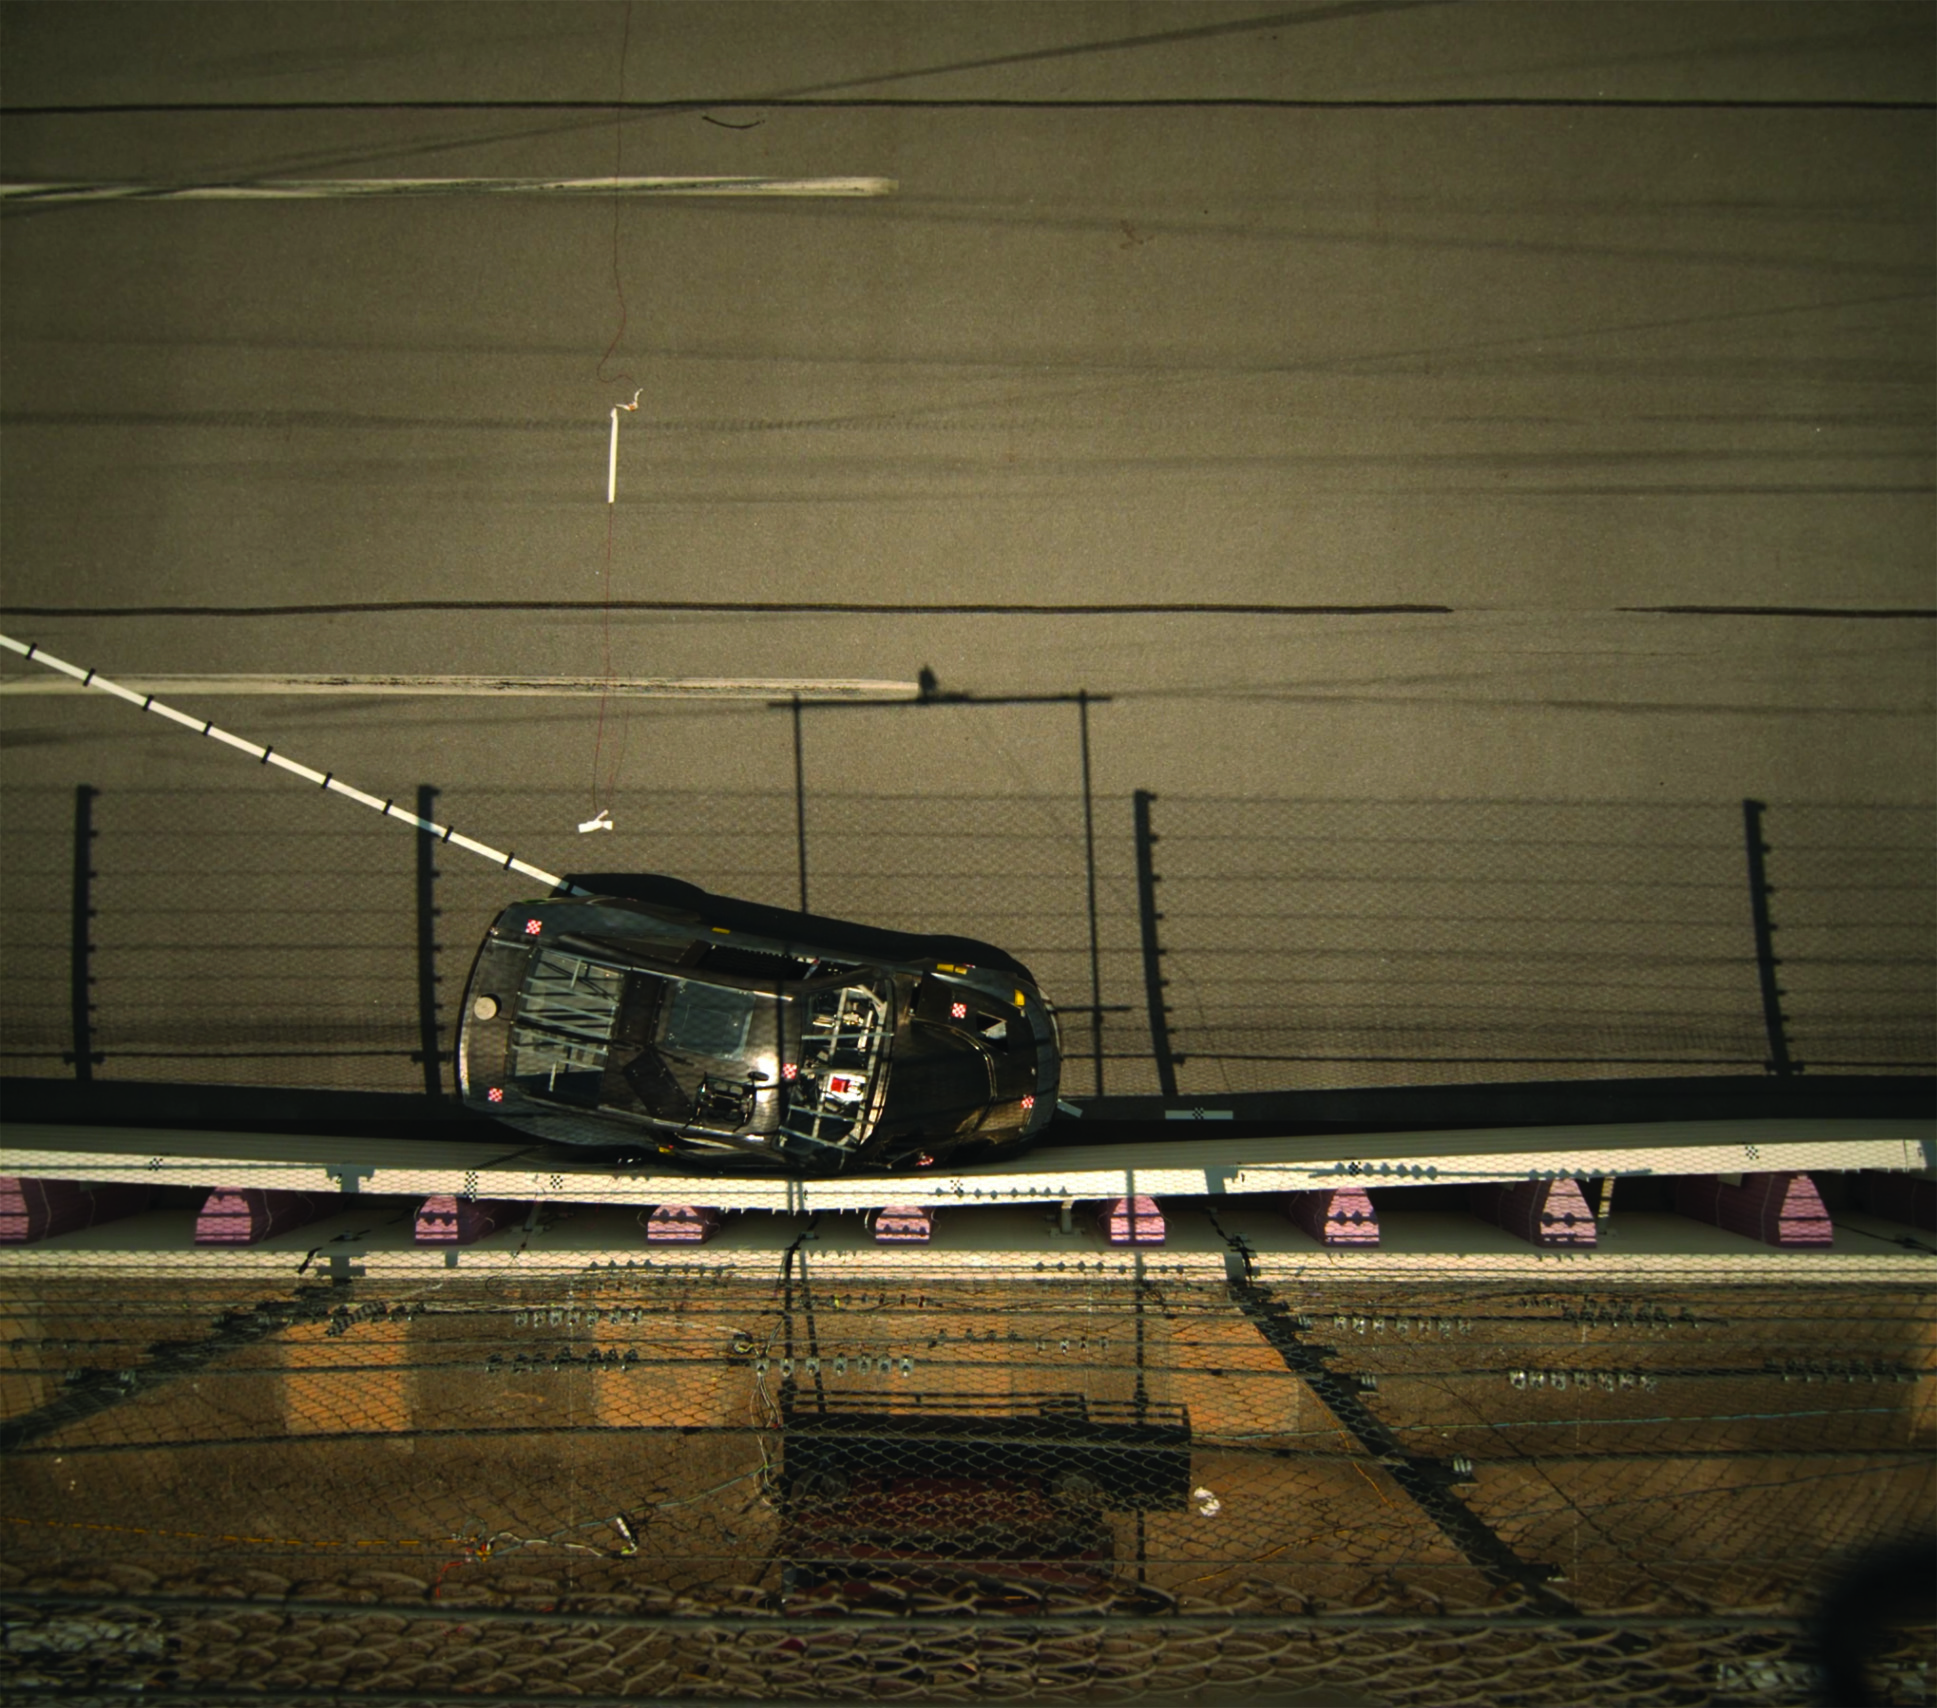
The Talladega setup consisted of NASCAR’s Hybrid III 50th Percentile Male frontal dummy with internal DTS data acquisition. There were dummy sensors, tri-axial accelerometers on the chassis as well as offboard cameras. The team spent two days slowly building up the crash test path at Talladega. They first ran three-quarters of the path with a last-minute, high-speed turn away from the steel and foam energy reduction (SAFER) barrier to avoid premature damage to the expensive Next Gen prototype.
“It was a high-stress environment, but they executed for us and we got good car and dummy data, good high-speed video and learned a lot,” Patalak reports. “We did further validation work with our LS-Dyna model through July, August and September, and committed to a few chassis structural changes for crash performance gains. We then repeated the [Talladega] test in October.”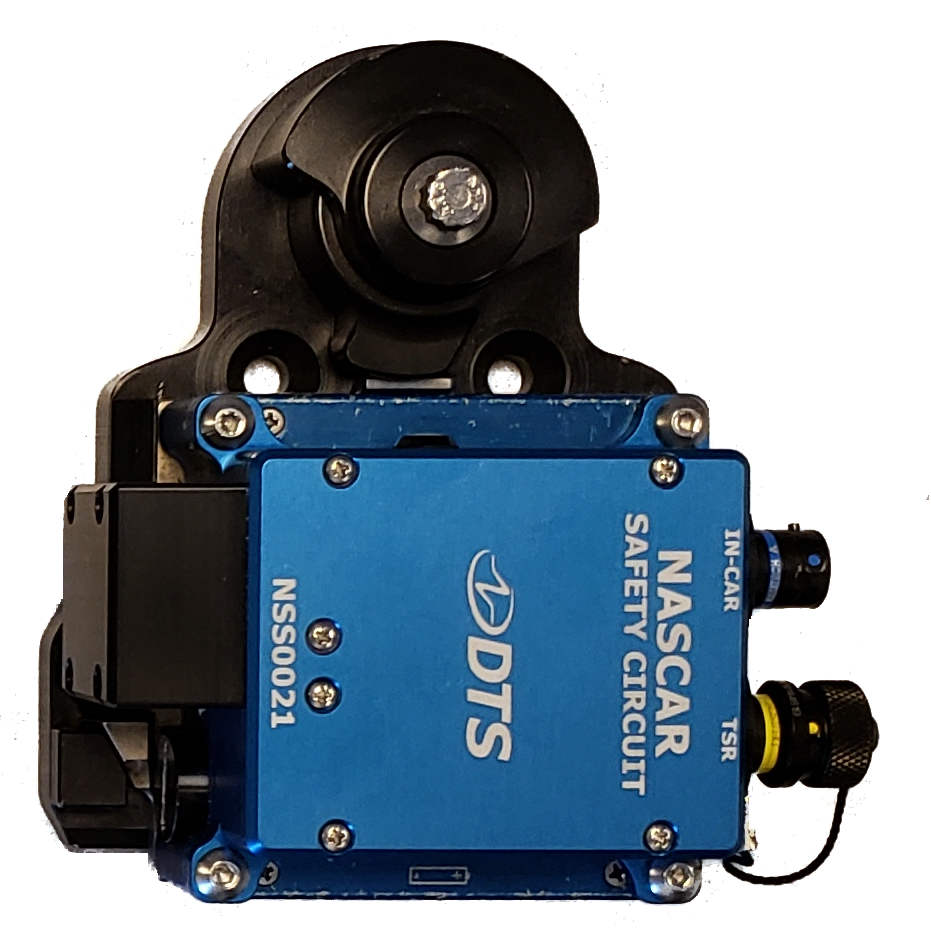 [pullquote]Above: NASCAR’s mandated incident data recorder[/pullquote]
Future developments
The results of previous human modeling work on driver seating position and restraint systems have been carried forward into the Next Gen machines. Also carried over are the onboard video cameras first introduced in 2018. From 2023, the video will be upgraded to a higher frame rate in conjunction with a new incident data recorder (IDR). This full DAS will have access to CAN data, including throttle position, brake pressure, steering angle and engine RPM. The data streams coming through the ECU will be synchronized and recorded as a crash file with the video and the currently recorded chassis tri-axial acceleration. In addition, NASCAR is adding its own 20Hz GPS antenna to the cars.
“We already have GPS data through a TV telemetry system at 5Hz, but as a car is approaching a wall, a lot of things happen in 200ms,” says Patalak. “The higher sampling rate is very important to us from a boundary condition standpoint for our simulation work. When you’re trying to understand the difference between 244km/h or 260km/h, those are hard things to answer with confidence with 5Hz data.
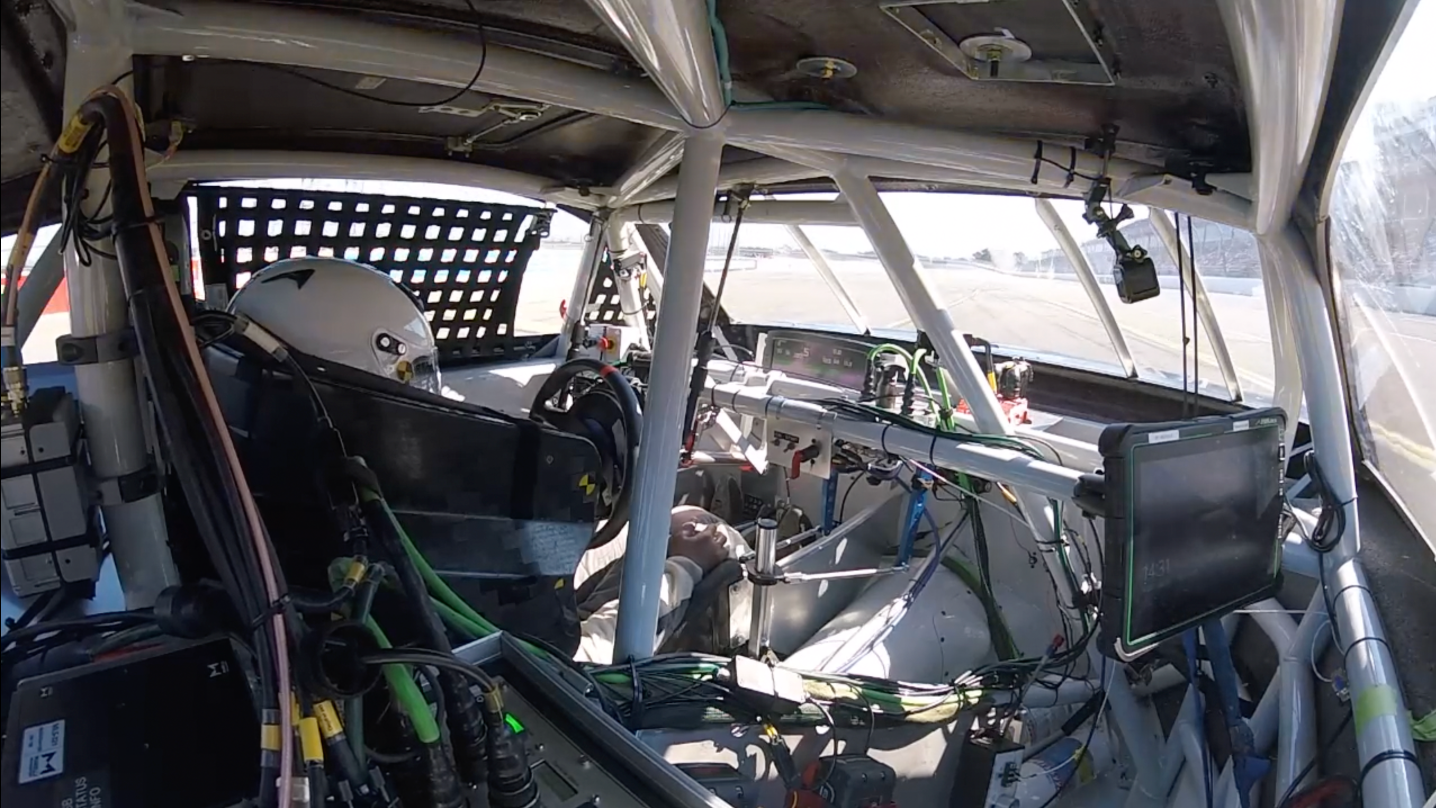
“The new system also has onboard processing capabilities. We’ve developed driver injury risk curves for AIS injury levels based on our historical data, taking into account peak acceleration, PDOF, Delta-V (change in velocity – crash severity) and the number of events inside the crash,” he explains. “The new system will be able to do those calculations in near real time and broadcast the information to race control. A crash at Daytona could involve 10 or 12 cars, for instance, and we have a finite amount of crash response vehicles; the new system is another tool to help us get the right resources to a car as soon as possible.”


